Pry as an Alternative to IRB
What is Pry?
Pry is a feature-rich alternative to the standard IRB (Interactive Ruby Shell) which provides tons of features including syntax highlighting, source code browsing, documentation browsing, dynamic code reloading, live editing of code and much more. More information about Pry can be found in their website. In this post I am going to describe how I use Pry for building and debugging my projects with examples as screenshots.
Features
Methods cd and ls
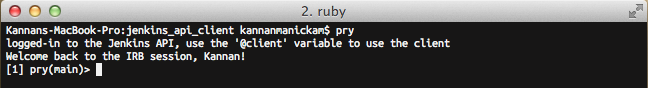
Once you are in the Pry session, you can change your scope to any Object you
want. During the development of my project
jenkins_api_client I often
use interactive Pry session to debug the code. Please take a quick look at my
project for easier understanding of the examples here. My .pryrc initializes
my project by setting up the credentials.
The @client instance variable is an object to the Client class. For example,
if I want to list all jobs available in jenkins, I have to access that using
@client.job.list_all. The @client object has a method called job which
will initialize the Job class and return an object which can then be used
for calling methods on the Job class. With the use of Pry, you can easily
change the scope so you do not have to use the chain of objects.
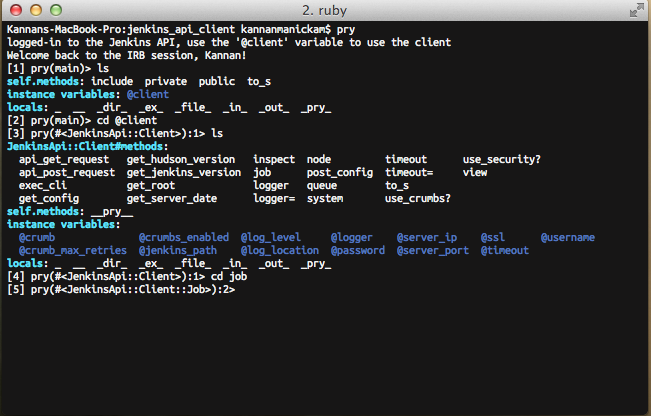
The cd command (just like changing the directory in Unix systems) can be used
to change the scope into the object specified as the argument. The ls command
can be used to list (just like listing files in Unix systems) all resources
available in current scope. If you want just the methods just do ls -m.
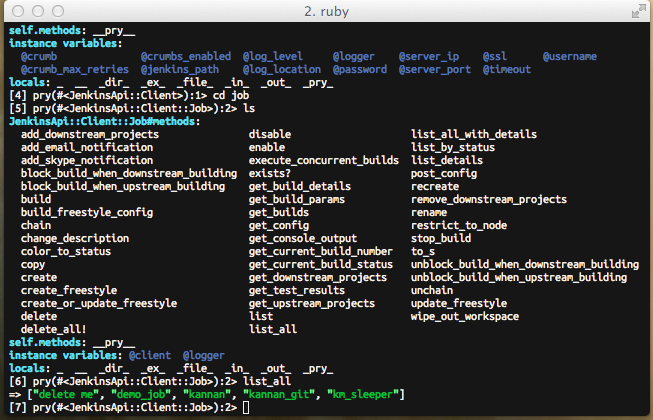
Now that we have changed the scope to the job object, we can call the methods
on that object by simply calling the method by the method name.
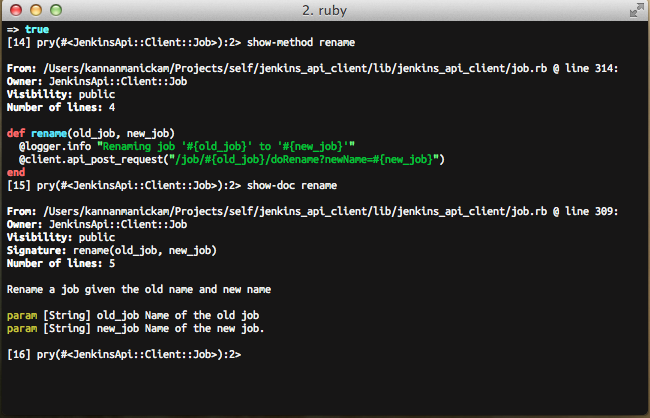
Methods show-method and show-doc
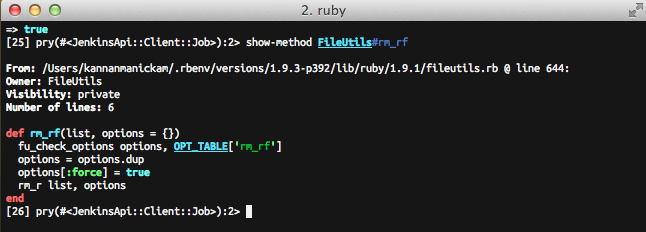
The show-method can be used for displaying the method. Similarly, the
show-doc method can be used for displaying the documentation of the given
method.
The show-method can also be used for system methods. For example, the rm_rf
method in the FileUtils class can be viewed simply by calling show-method
FileUtils#rm_rf.
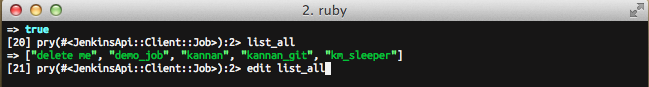
Editing of methods and live reload of code
If you are working on a method and want to edit and see the behavior for the
change, you can simly use the edit method and specify the method name. It
will open your default editor. Since I have my default editor set to vim,
this example opens up vim in the shell itself.
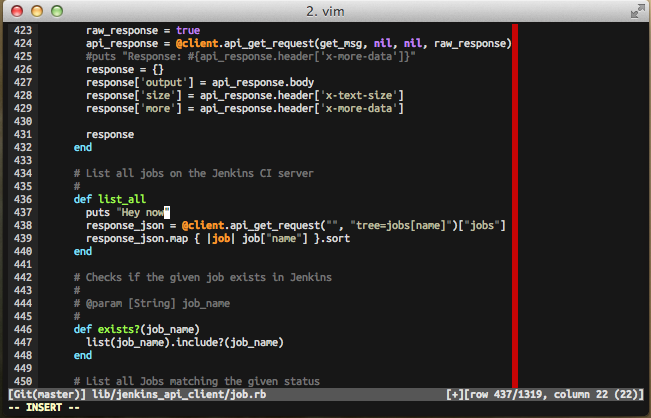
In the following screenshot, you can see that the editor is opened and the cursor is pointing to the correct method.
Once the the edit is completed and the file is saved, the editor is closed and you will be returned to the Pry session. As Pry automatically reloads code for the class the method resides, if you execute the method again, the code changes will be reflected.
Note: Do not wonder why there is a red line at the 80 character mark. I
follow the ruby style guide of limiting character width to 80 characters. I use
the colorcolumn feature in Vim.
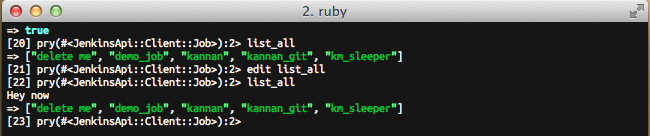
Bingo! The code change can be seen clearly.
These examples are just a few that are used for development and debugging. It provides much more functionality. Check out more examples and screencasts on pryrepl.org